
On January 24th, 2025, the MAGDA consortium convened in Saluzzo, Italy, for a key project progress m
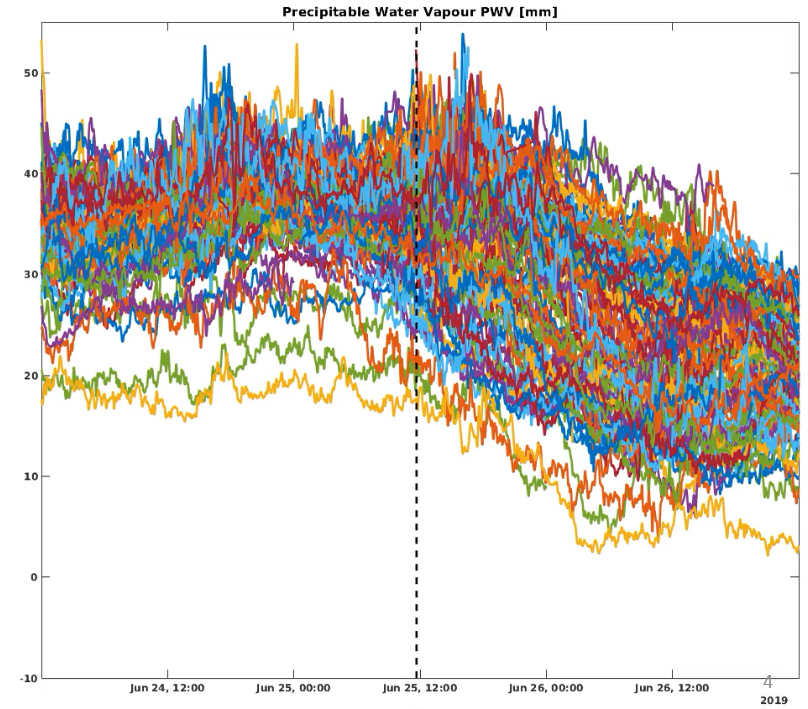
In the framework of the MAGDA project, Meteomatics launched its Meteodrone system in Burgundy, Franc
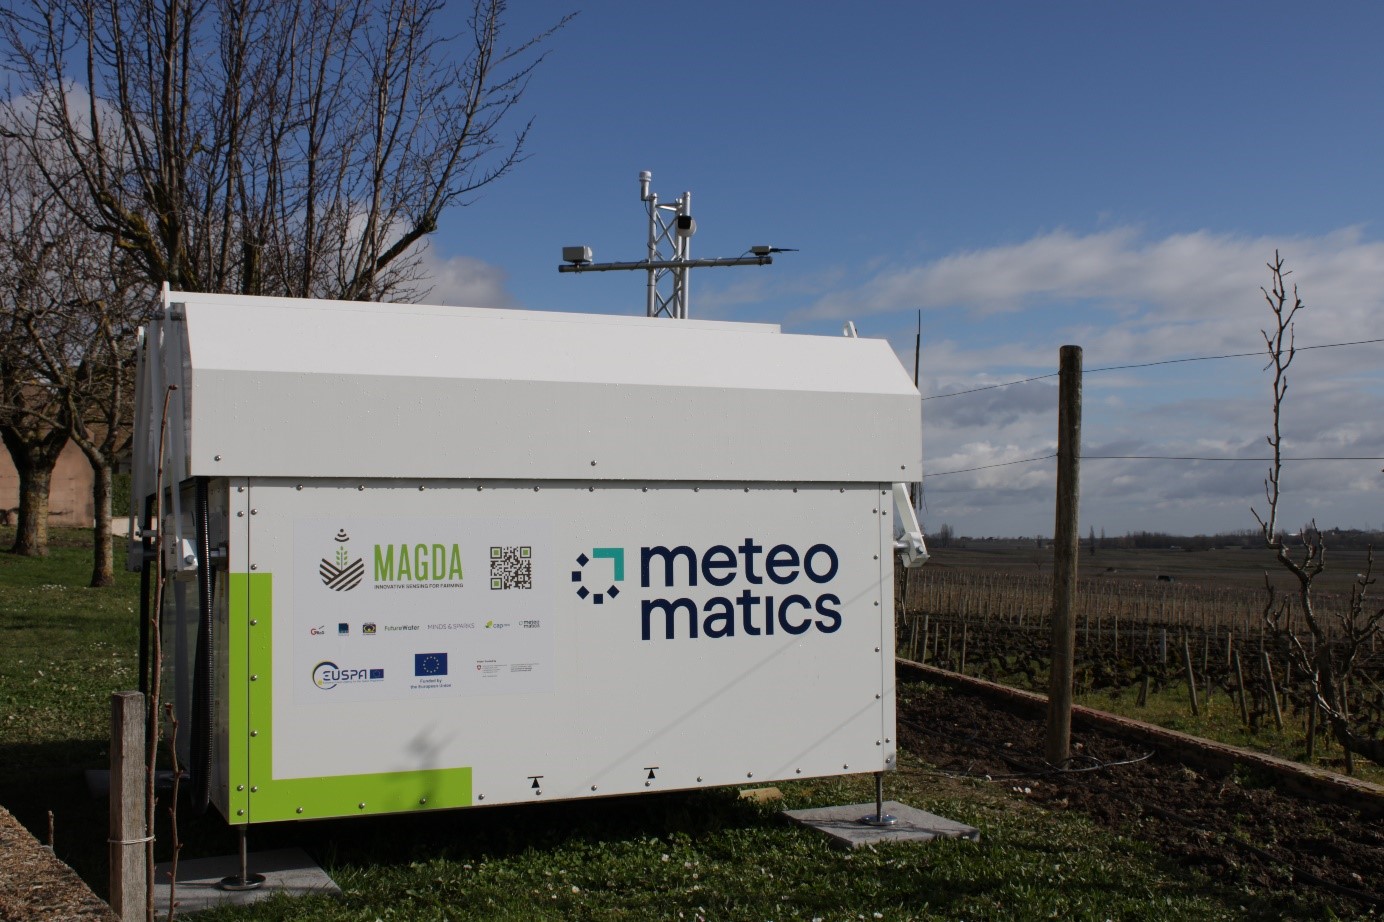
On March 5th, Meteomatics launched its Meteodrone system operations in Burgundy, France, specificall